Introduction to gnuplot
Have you ever been frustrated in math classes due to lack of visual examples of abstract topics? Have you ever wanted to quickly visualize a dataset without going through cumbersome software like Excel?
If so, you should know about gnuplot.
Gnuplot is a command line based graphing and plotting utility. In this post, I’ll outline some practical applications of gnuplot as well as some tips.
Install gnuplot⌗
Most distos should have gnuplot in their repositories. I installed gnuplot on Arch linux by running sudo pacman -Syu gnuplot
To start using gnuplot, fire up your favorite terminal and run gnuplot. You should be faced with a prompt like so:
	G N U P L O T
	Version 5.2 patchlevel 7    last modified 2019-05-29

	Copyright (C) 1986-1993, 1998, 2004, 2007-2018
	Thomas Williams, Colin Kelley and many others

	gnuplot home:     http://www.gnuplot.info
	faq, bugs, etc:   type "help FAQ"
	immediate help:   type "help"  (plot window: hit 'h')

Terminal type is now 'qt'
gnuplot>
2D Plotting⌗
Now we are ready to start graphing. Let’s start with the simple function.
To plot this in gnuplot, simply enter the following into your prompt:
plot x**3
\mathring{g}
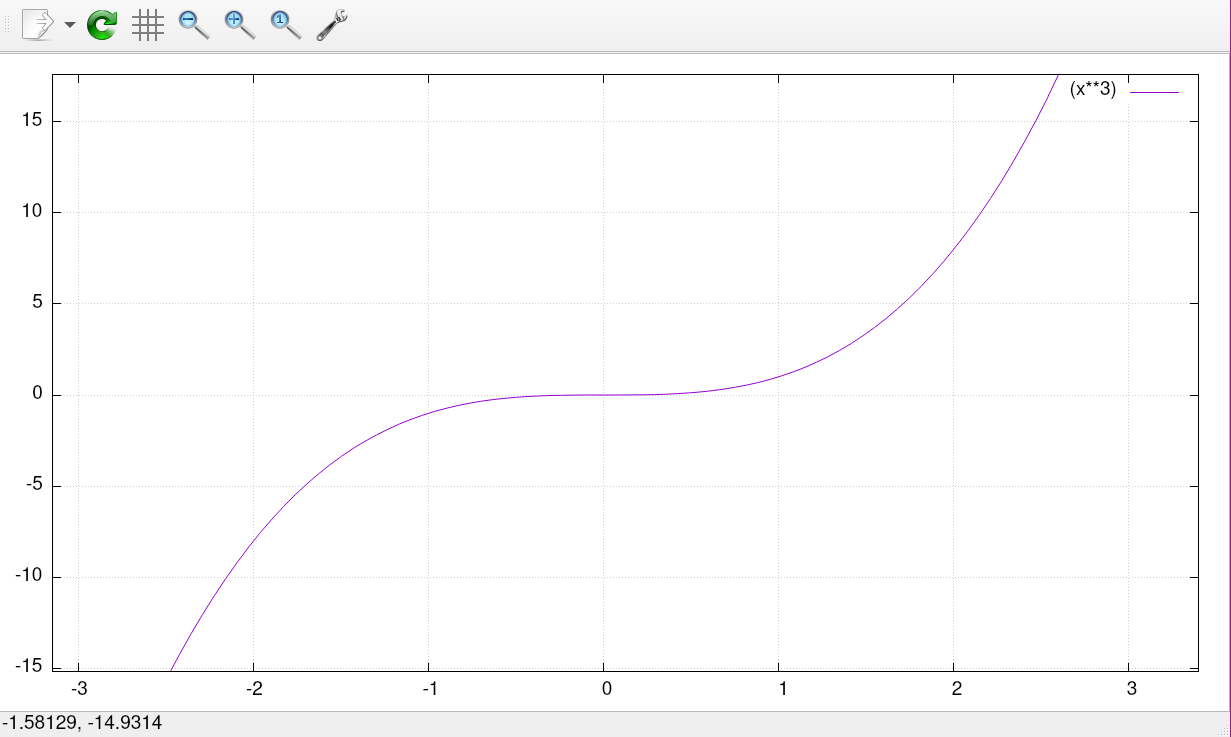
This looks pretty much like we would expect it to. If we want to plot multiple functions to compare, we can simply add it to the plot command.
plot sin(x), cos(x)
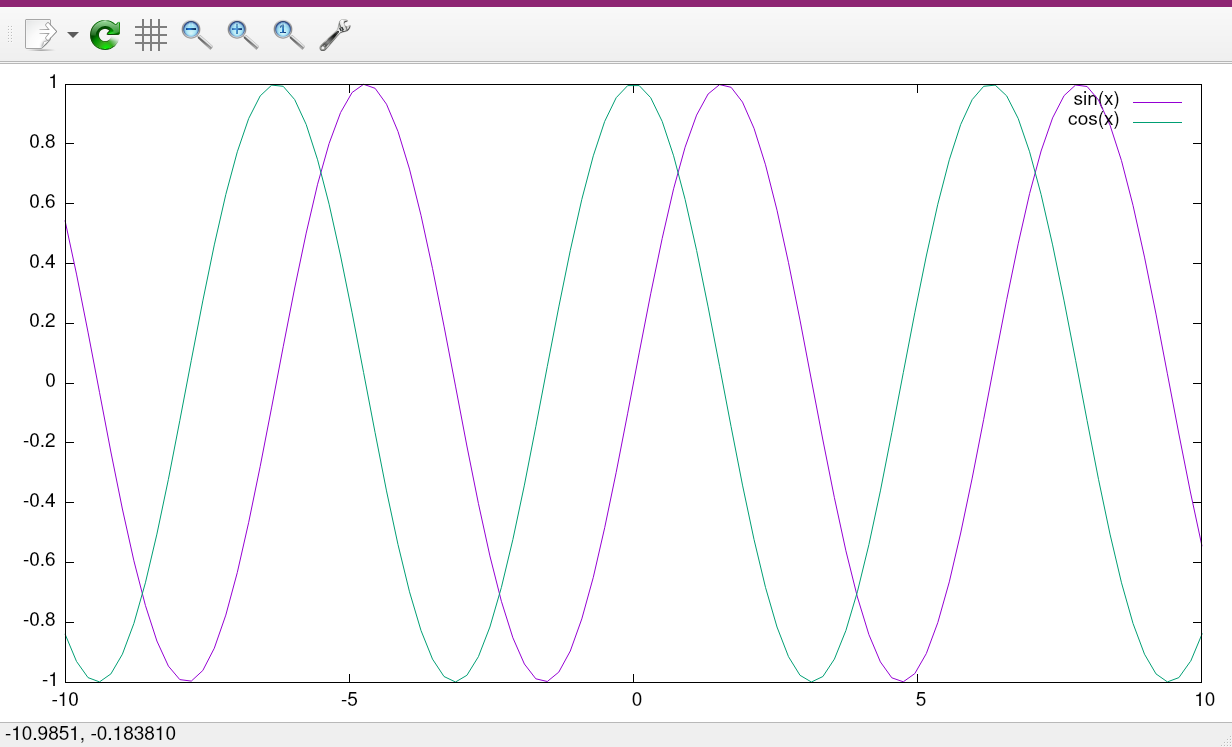 $$f(x) = sin(x)$$
$$g(x) = cos(x)$$
3D plotting⌗
Plotting functions in two dimensions is great, but what about three dimensional functions? Let’s see what
$$ f(x) = sin(x)*cos(y) $$
looks like in 3D. Enter the following into gnuplot:
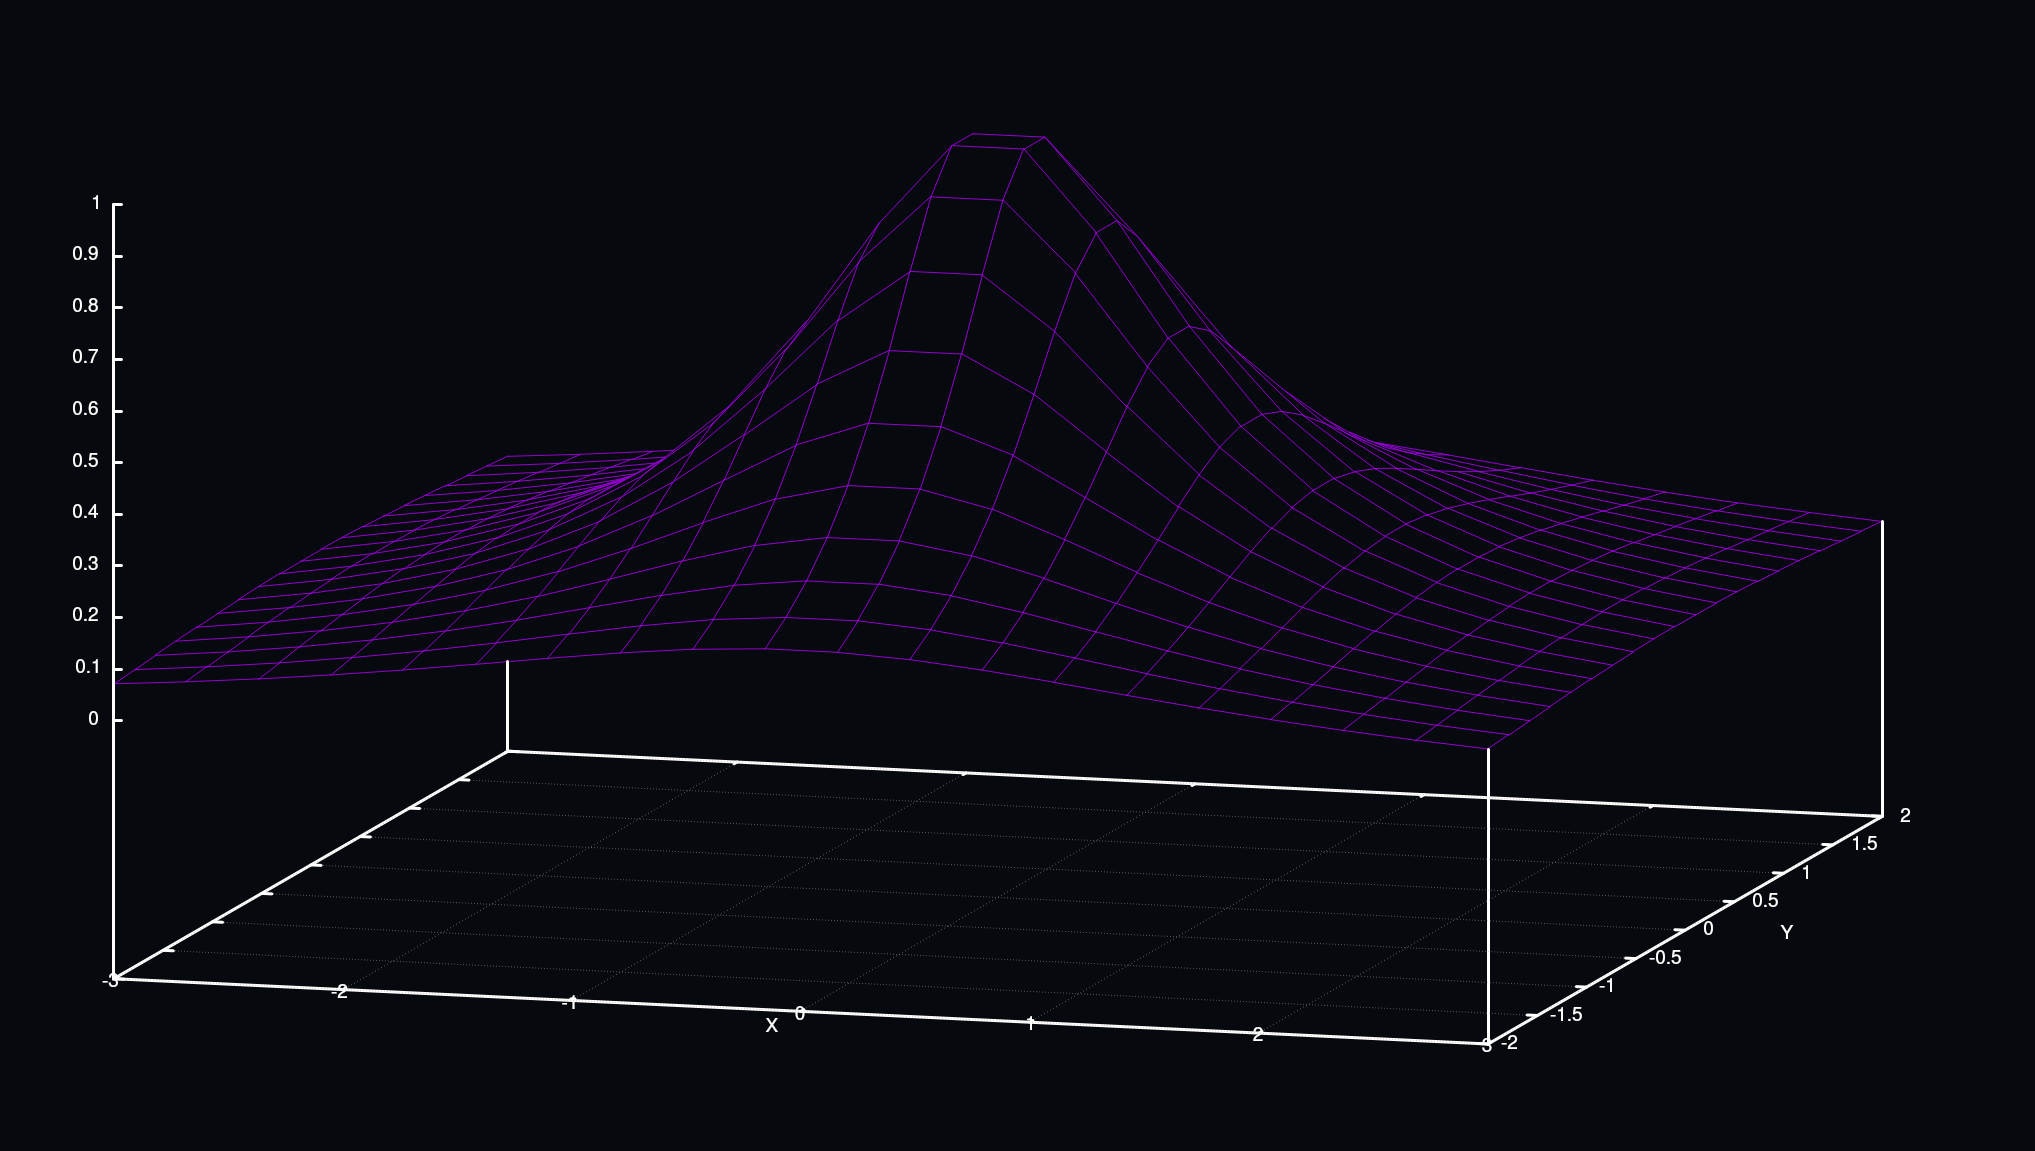
set isosamples 50
set hidden3d
splot [0:2*pi] [0:2*pi] sin(x)*cos(y)
- The
set hidden3dcommand disables the wireframe, making it easier to see the contours of the 3D objects. Try it both ways with theunset hidden3dcommand, use whichever you prefer. - Setting our isosamples to 50 gives us a much smoother plot.
- In gnuplot, the
splotis identical to theplotcommand, except it will make a 3-dimensional plot. - The
[0:2*pi] [0:2*pi]section specifies a domain for each of these functions, which is zero to 2π (the period of the cosine and sine functions)
After running these commands, we get
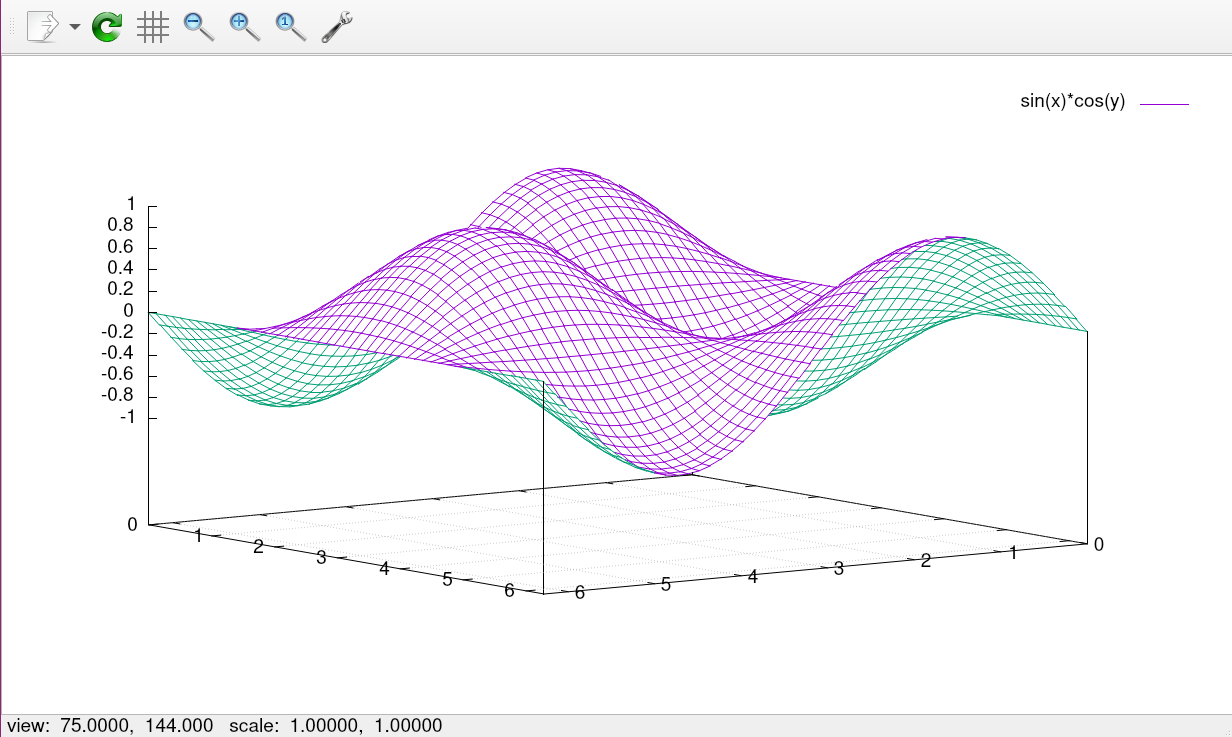 $$ f(x) = sin(x)*cos(y) $$
I would recommend checking out the gnuplot demos page, which has tons of functions and scripts to play around with. There are many more features than I could ever hope to cover here, so this is a great place to explore.
Plotting data⌗
Say that we ran some experiments and we wanted to quickly plot the results. To keep things simple, let’s start out with a 2D graph that might be commonplace on homework assignments and research projects.
First, we need our data file. Data files in gnuplot use the .d extension by default. In the case of 2 dimensions, there will be two space-separated columns for our points, with two line breaks signifying a new data block.
For this example, I using a classic classroom experiment of tracking the growth of plants over time. The left column represents the day, and the right hand is the height in inches.
# Flower number one
1 1.3
2 1.8
3 2.1
4 2.4
5 2.4
6 2.9
7 3.2


# Flower number two
1 1.0
2 1.1
3 1.6
4 2.1
5 2.6
6 3.0
7 3.3
To plot this data, we can simply run
plot 'flowers.d'
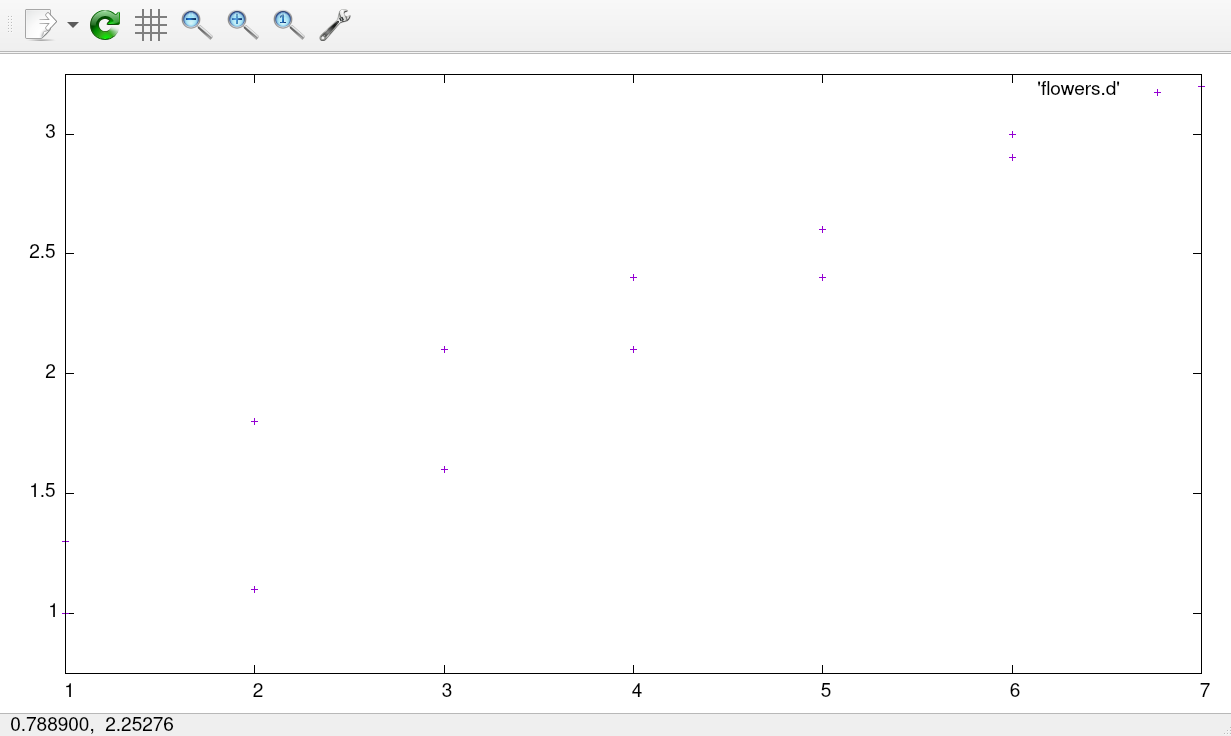
This looks OK, but it doesn’t really tell the whole story and it certainly isn’t up to research (or even science fair) standards. Let’s spruce this plot up a bit!
set title font "Helvetica,14"
set title 'Flower Growth Over Seven Days'
set xlabel 'Time (Days Elapsed)'
set ylabel "Height (Inches)"
plot 'flowers.d' index 0 w lp lw 3 title 'Flower 1', 'flowers.d' index 1 w lp lw 3 title 'Flower 2'
indexchooses the block from the dataset to plot (each block is separated by two blank lines)w lp: short forwith linepoints, which styles the lineslw: short forline widthtitlesets the key label for the corresponding data block
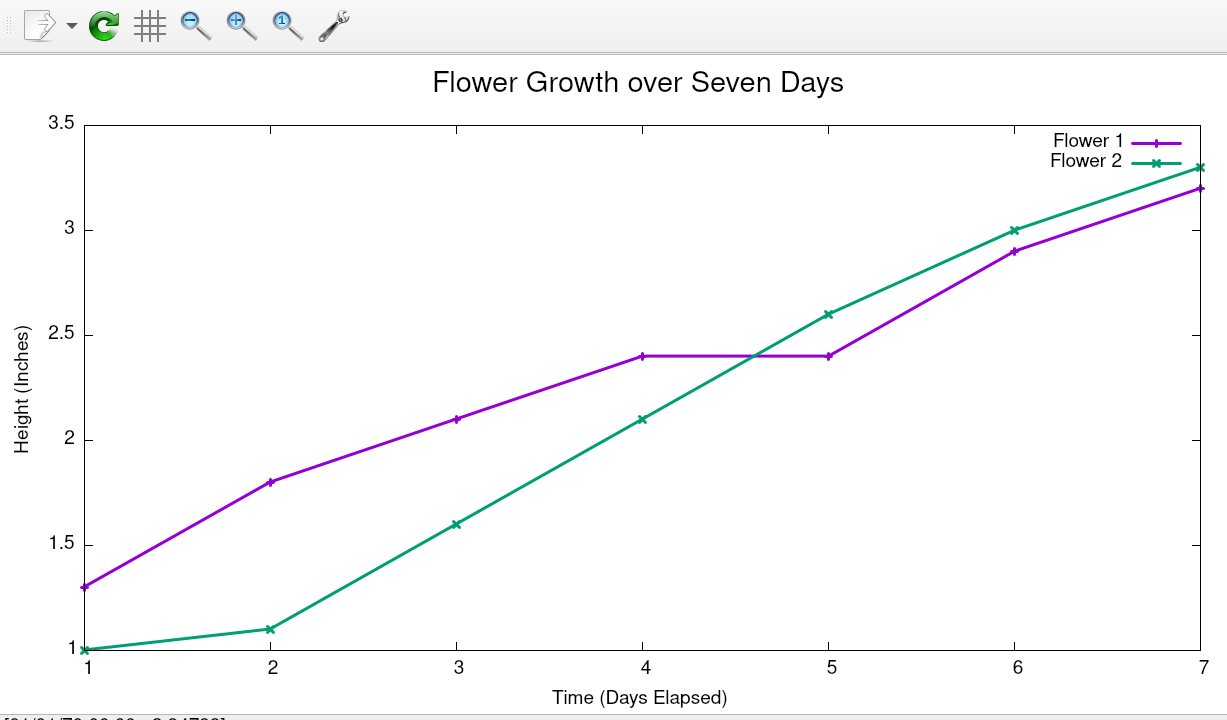
Looks much better!
Conclusion⌗
We learned how to use gnuplot to quickly create a graph out of experimental data, as well as plot equations in two and three dimensions. I have barely scratched the surface of this program, and I will share my knowledge with you as I continue to learn. In the future, I want to explore more advanced gnuplot features such as parametric equations and data fitting. I also hope to develop an automatic gnuplot theming script, that would act like my Zathura-Pywal utility and automatically color gnuplot based on the system colors. Keep an eye out for updates!